1. Music Representations
At each stage of the music performing pipeline, different representations are needed. The formats of music in the pic above, from left to right, are sheet music, symbolic representation and audio representation.
1.1 Sheet Music & Symbolic Representations
Traditional sheet music supports and music timing score only, and can be stored in MusicXML format. Musicians may vary the tempo, dynamics, and articulation, resulting in a personal performance of the given musical score. So sheet music is rarely directly used as input to neural network models.
Piano roll is a kind of symbolic representation as a visual, image-like representation of music, and can be stored in MIDI format. It can contain rich performance information and supports both score and performance, either music timing (after quantization) or absolute timing. It is more convenient to be used as input to neural networks, and datasets of MIDI files are easily accessible.
Tools:
- MusPy is an all-in-one lib for symbolic music generation.
- PyPianoroll can intuitively manipulate MIDI files as piano rolls.
- Miditoolkit is designed for handling MIDI in symbolic timing (ticks), which is the native format of MIDI timing.
- PrettyMIDI can parse MIDI files and generate pianorolls in absolute timing.
- MidiTok can take care of converting (tokenizing) your MIDI files into tokens, ready to be fed to models such as Transformer, for any generation, transcription or MIR task
- MuseScore is a software that can manipulate the music files in MIDI, MusicXML and audio formats.
1.2 Audio Representation
Audios also have 2 kinds of representations. They can be visualized as waveforms stored in *.wav files, but it does not show the components with different frequencies in the audio. By applying discrete short-time fourier transform and other transforms, the waveform can be transformed into time-frequency representation, called spectrogram.
Audio Representations in Spectrogram:
- Short-Time Fourier Transform (STFT): directly generated by applying discrete short-time fourier transform to waveforms, represent linearly-spaced time, magnitude and frequencies. The value at each point specified by time and frequency is a complex number, the norm representing the magnitude of the wave with this frequency at this time, and the arg representing the phase of this wave. So if you need only the magnitude, considering that phases do not affect human perception of sounds, you need to apply
np.abs()to take only the norm of each complex number.
(⬆這段不知道説清楚了沒有,再用中文解釋一下。STFT 是直接對波形做短時離散傅里葉變換獲得的,其結果是一個二維的表格,對每一個時間點和每個頻率給出一個複數,表示在這個時間點上這個頻率的聲波分量。複數的模長表示該分量的振幅,複數的輻角表示該分量的相位。由於影響人聽覺的不是每個分量的相位,而是聲音中含有不同頻率的波的比例,所以可以用
np.abs()函數來取複數的模長,忽略相位信息)
- Constant-Q Transform (CQT): logarithmic frequency, logarithmic magnitude. The reason of taking the logarithm is that human hearing perceive the sound intensity and pitch on a logarithmic scale. For example, the sound pressure need to be about 1.22 times of the original sound pressure if we want the dB value to be larger by 1, and the foundamental frequency of a sound need to double if we want it to rise by 1 octave.
- Pitch Class Profile / Chromagram: a 12-element feature vector indicating how much energy of each pitch class, {C, C#, D, D#, E, ..., B}, is present in the signal, ignoring the octaves
- Mel-Spectrogram: the mel scale is a perceptual scale of pitches judged by listeners to be equal in distance from one another, with finer resolution in the low-frequency range (NOT exactly logarithmic scale)
Different spectrograms are used as input to CNN to deal with different tasks of music feature extraction.
- Timbre representation: Spectrogram → Mel-Spectrogram → MFCC
- Pitch representation: Spectrogram → CQT → Chroma Feature
Dataset:
Tools:
- Sonic Visualiser is like an Adobe Audition adapted for music
- librosa is a acoustic python package for music and audio analysis
- torchaudio implements feature extractions commonly used in the audio domain
1.3 Math in STFT: Frequency & Temporal Resolution
Sampling Rate: number of samples per second in a piece of audio.
Nyquist–Shannon Sampling Theorem: A signal must be sampled at least twice as fast as the bandwidth of the signal to accurately reconstruct the waveform; otherwise, the high-frequency content will alias at a frequency inside the spectrum of interest. So in music with sr = 44.1k Hz, we cannot hear frequency higher than 44.1k / 2 = 22.05k Hz. To avoid aliasing, the analog music signal need to be lowpass filtered before sampling.
Quantization: Round the amplitude to the nearest discrete steps.
Bit depth is the number of bits used to represent the amplitude at one sampling point. It determines dynamic range of digital signals. Dynamic range = \(20\log_{10}\frac{\max}{\min}\)
Much basic audio processing is done in MATLAB. These code can help understanding the concepts in this section.
[a,sr] = wavread('...') % sr = sampling rate
length(a) % length of the signal in 'number of samples'
length(a)/sr % length of the signal in 'seconds'

a2 = downsample(a,2);
sr2 = sr/2;
length(a2) % length of the signal in 'number of samples'
length(a2)/sr2 % length of the signal in ‘seconds’
wavwrite(a2, sr2, 'test.wav')
sr = 200;
t = 0:1/sr:1;
f0 = 10; % frequency
a = 1; % amplitude
y = a*sin(2*pi*f0*t + pi/2);
stem(t,y)
Fourier transfrom can get the spectrum of a whole piece of signal. But since the music signal is not constant, it makes no sense to analyze the spectrum of a whole song. Short Time Fourier Transform (STFT) is a windowed version of fourier transform that analyze the signal divided into small windows, so that we can represent the feature of a music audio in each short period. win_size is defined as the size of the window, and hop_size is defined as the distance between the starting of two adjacent windows. They are not necessary to be the same.
Understanding STFT
- Shorter window → worse frequency resolution, longer window → worse temporal resolution
f_max = sr / 2, because of Nyquist–Shannon Sampling Theoremfreq_resolution = sr / win_sizetemporal_resolution = hop_size
Y = abs(fft(y)); % To get the spectrum of a signal
spectrogram(y, window, noverlap, nfft) % Render the spectrogram of a signal
spectrogram(y, 100, 50, 100, sr, 'yaxis')
Summary
Terminology Reference:
Sheet Music
- meter: 節拍
- tempo: 節奏, measures the speed
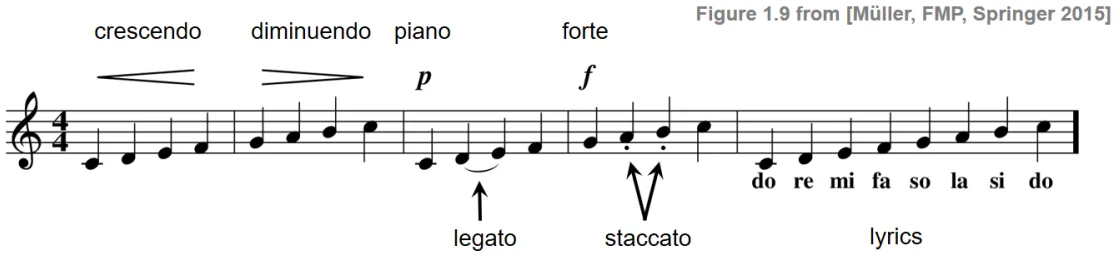
- dynamics: 力度, measures how hard a part of music is played
- articulation: 奏法
- Articulation Marks: denote how certain notes are to be played, including marks in the pic below
Piano Roll
- MIDI note number (0-127): pitch of the sound, can be calculate using the fundamental frequency of the note
- Key velocity (0-127): intensity, not speed
- MIDI channel: different instruments
- Time stamp: how many clock pulses or ticks to wait before the command is executed
- Clock pulses / ticks: basic time units subdivided from quarter notes
- Pulses per quarter note (PPQN): commonly 120, determines the resolution of the time stamps associated to note events
Audio Representation
- mono & stereo, monaural & binaural, 單聲道(的)、多聲道(的)
- Pitch class: Two notes with fundamental frequencies in a ratio of any power of two, which means they differ by octaves, are perceived as very similar. All notes with this kind of relation can be grouped under the same pitch class. e.g. pitch class C = {..., C2, C3, C4, ...}